
Keyword
Regional Seas | Coral Sea
335 record(s)
Type of resources
Topics
Keywords
Contact for the resource
Provided by
Formats
Update frequencies
Status
draft
-
The standard deviation of sea surface height (in metres) estimated on a 0.2x0.2 degree grid for the region: 90E-180E, 60S-0. Sea surface height variability was estimated from tide gauges and altimeter GDR height observations for the years 1993-2001. The gridded fields are created using optimal interpolation and the grid scale is smaller than the largest gaps between satellite tracks so fine scale 0(50km) height gradients in the ocean are often missed. For most of the time data were only available from two satellites and at times only one.
-
Monthly standard deviation of sea surface height (in metres) estimated on a 0.2 x 0.2 degree grid for the region: 90E-180E, 60S-0. Data used in making the estimates are the gridded maps of height for 1993-2001 based on tide gauge and altimeter observations. The gridded fields are created using optimal interpolation and the grid scale is smaller than the largest gaps between satellite tracks so fine scale O(50km) height gradients in the ocean are often missed. For most of the time data were only available from two satellites and at times only one.
-
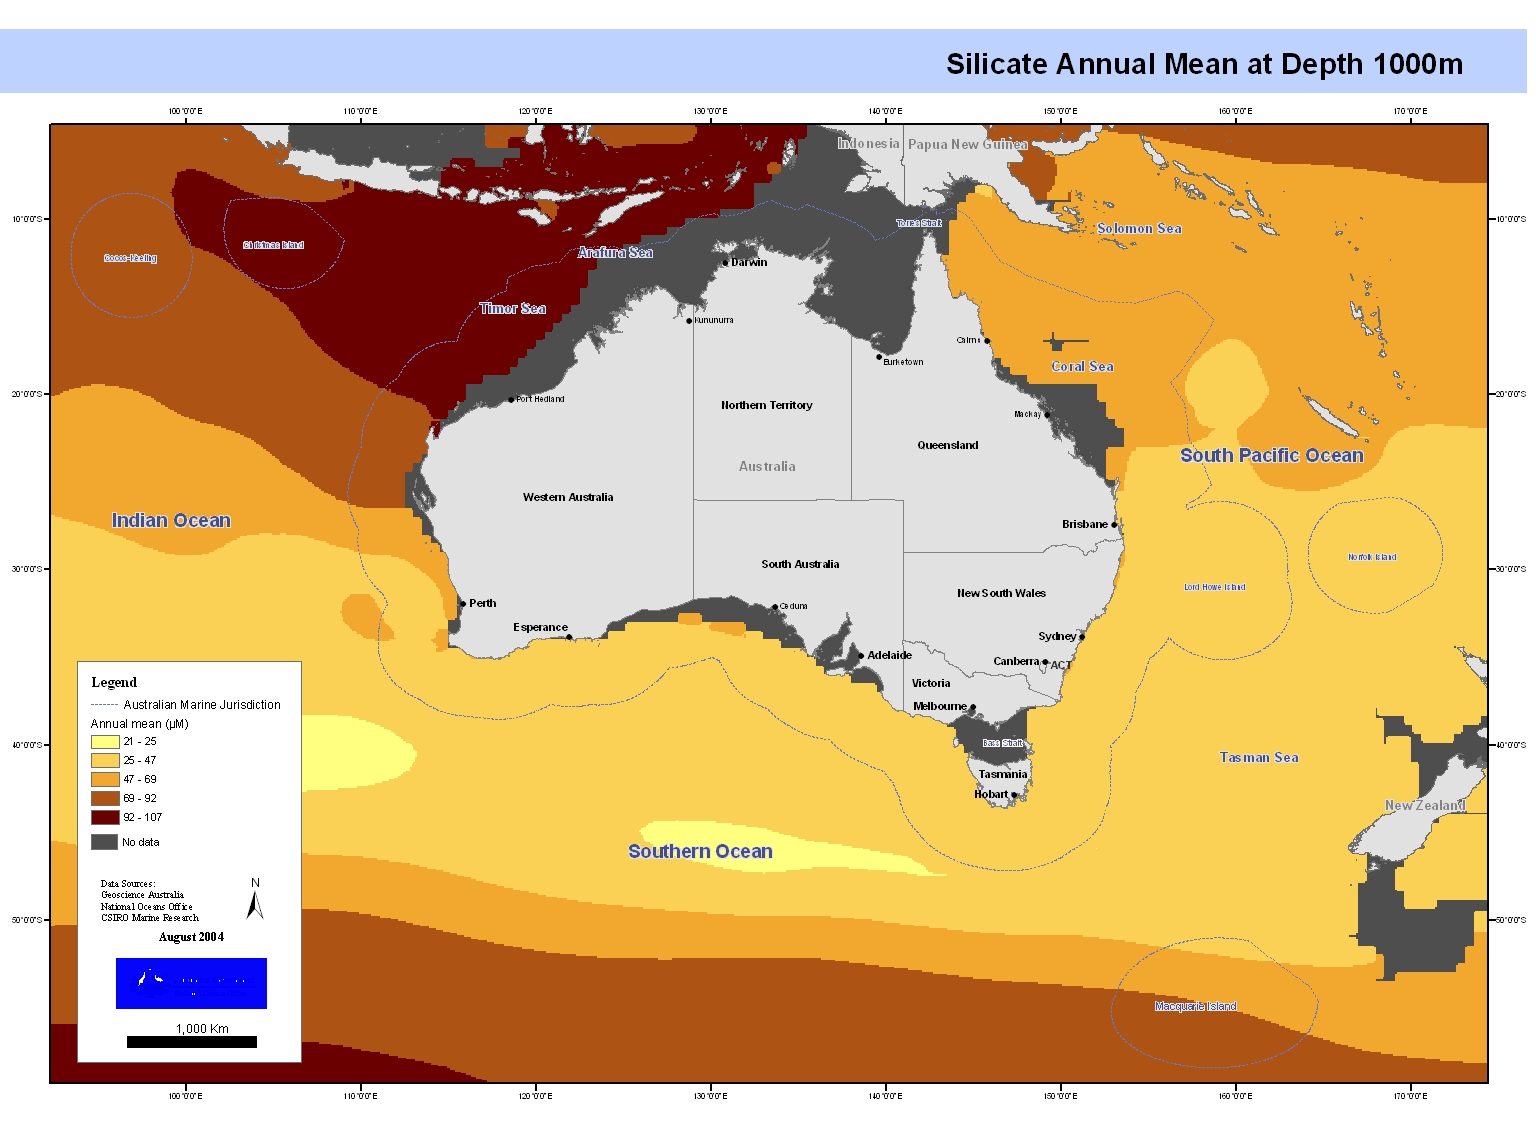
Set of maps showing sea surface silicate linearly interpolated from CARS2000 mean and seasonal fields to 0.1 degree spaced grid. These maps form part of a series of maps showing the variation of temperature, salinity, oxygen, silicate, phosphate, and nitrate in Australia's Oceans. Each feature in the series has been separately mapped at depths of 0, 150, 500, 1000 and 2000 metres. These maps have been produced by CSIRO for the National Oceans Office, as part of an ongoing commitment to natural resource planning and management through the 'National Marine Bioregionalisation' project.
-
Dynamic height of sea surface height and currents referenced to 2000m, computed from CARS2000 3-dimensional seasonal temperature and salinity fields. Monthly values derived from annual and semi-annual temperature and salinity cycles. CARS is a set of seasonal maps of temperature, salinity, dissolved oxygen, nitrate, phosphate and silicate, generated using Loess mapping from all available oceanographic data in the region. It covers the region 100-200E, 50-0S, on a 0.5 degree grid, and on 56 standard depth levels. Higher resolution versions are also available for the Australian continental shelf. The data was obtained from the World Ocean Atlas 98 and CSIRO Marine and NIWA archives. It was designed to improve on the Levitus WOA98 Atlas, in the Australian region. All known reliable published data is used, but this is still very sparse in the SW, at depth, and especially for some nutrients. In many places strong interannual signals (which in many cases we do not attempt to resolve nor compensate for) may be aliased into spatial or seasonal signals.
-
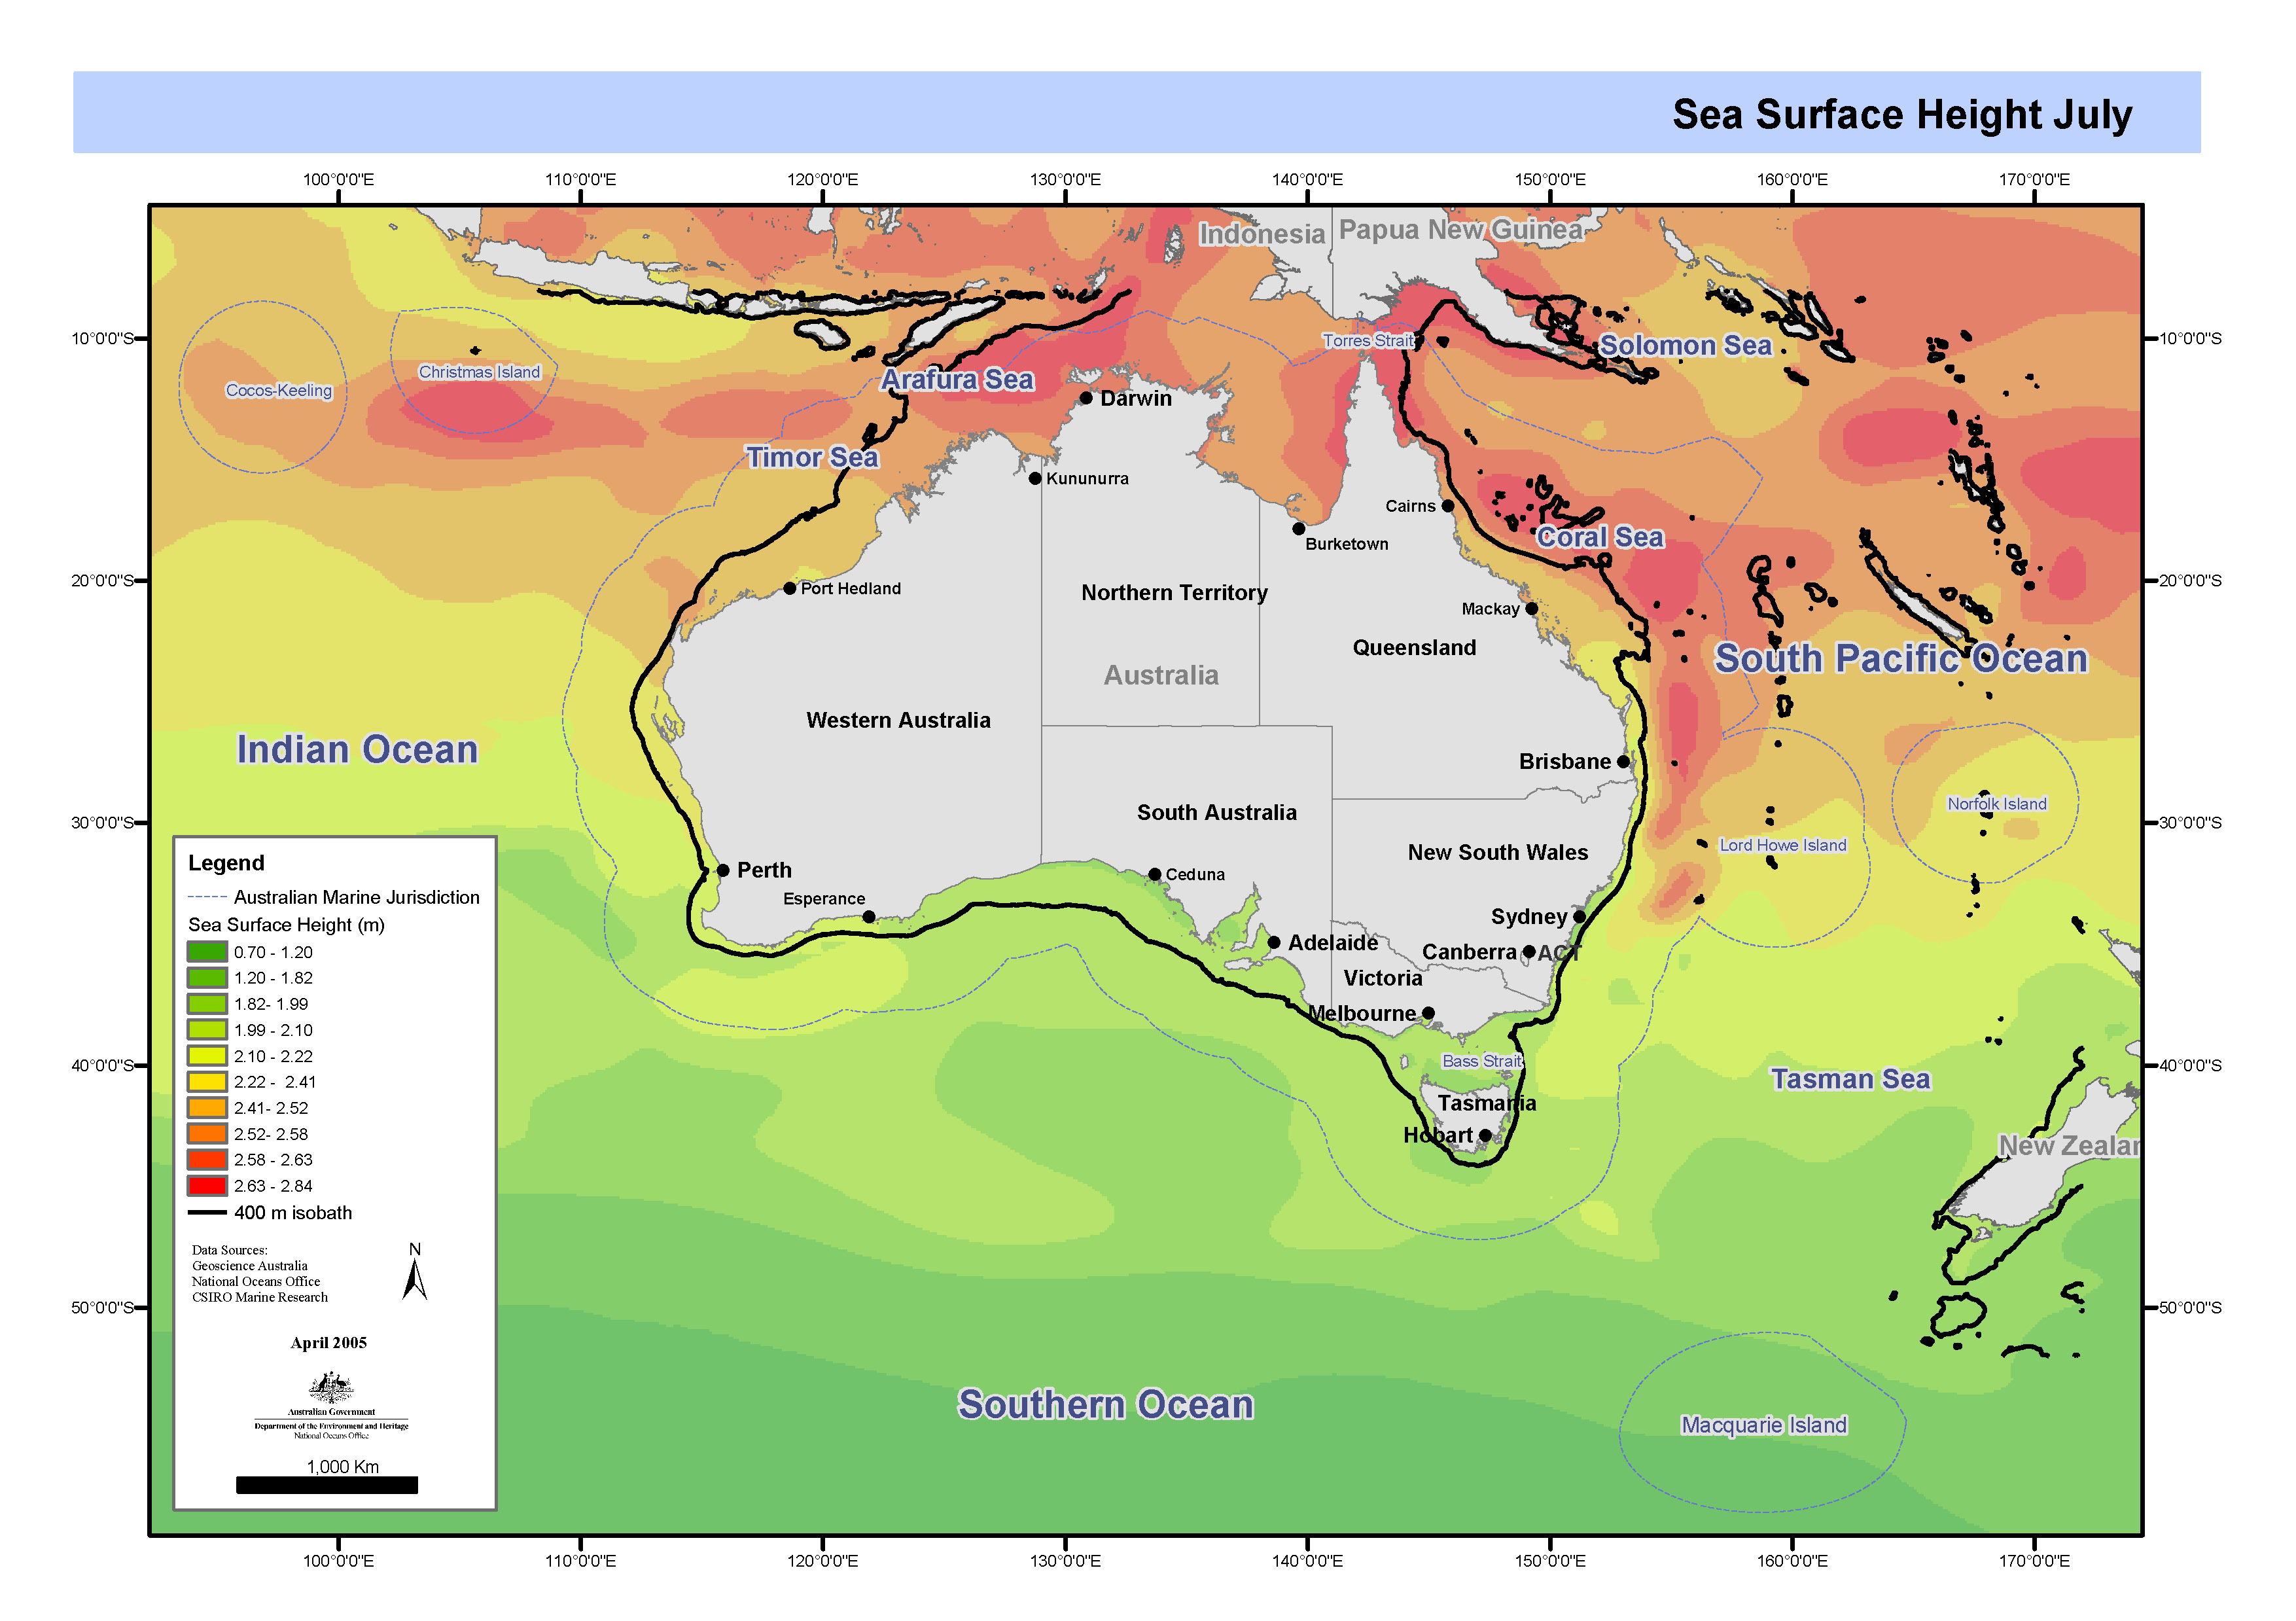
Set of four maps of mean sea surface height derived from annual and semi-annual temperature and salinity cycles stored in CARS2000. CARS is a set of seasonal maps of temperature, salinity, dissolved oxygen, nitrate, phosphate and silicate, generated using Loess mapping from all available oceanographic data. It covers the region 100-200E, 50-0S, on a 0.5 degree grid, and on 56 standard depth levels. Higher resolution versions are also available for the Australian continental shelf. The data was obtained from the World Ocean Atlas 98 and CSIRO Marine and NIWA archives. It was designed to improve on the Levitus WOA98 Atlas, in the Australian region. These maps have been produced by CSIRO for the National Oceans Office, as part of an ongoing commitment to natural resource planning and management through the 'National Marine Bioregionalisation' project. Sea surface height not defined for depths less than 400m.
-
Maps showing quarterly means of wind curl on Australia's oceans from interpreted basedata supplied by the National Centers for Environmental Prediction (NCEP) Re-analysis Project, 1976 to 1998 inclusive. These maps have been produced by CSIRO for the National Oceans Office, as part of an ongoing commitment to natural resource planning and management through the 'National Marine Bioregionalisation' project.
-
These data, reported in various volumes of CSIRO's "Oceanographic Station List" series between 1957 and 1962, comprise mainly measurements of surface temperature, salinity (as chlorinity), and (in later stages) phosphate from sea surface samples collected by the merchant ships MV "Tulagi" and MV "Malaita" on regular runs between Australia's east coast and New Caledonia via Norfolk Island ("Tulagi") and New Guinea ("Malaita"). Sampling began in 1955 and was still in progress December 1960, the last date for which data were published in this series. The merchant vessel sampling program was carried out at a time when the CSIRO Division of Fisheries had no dedicated ocean-going research vessel, as a means of acquiring information about offshore waters. In the volumes cited, similar data are also reported from the Tasman Sea, south-eastern Australian waters and Bass Strait, and the south-east Indian Ocean.
-
This data set contains Simrad EK500 single beam echosounder data at 38 and 120 kHz and Simrad EA500 single beam echosounder data at 12 kHz from the Southern Surveyor. The EK500 data is primarily for water column characterisation (fish stocks, microplankton distribution) and on occasions for seabed classification (particularly prior to the EM300 swath mapper being installed), while the EA500 data is primarily for bathymetric readings.
-
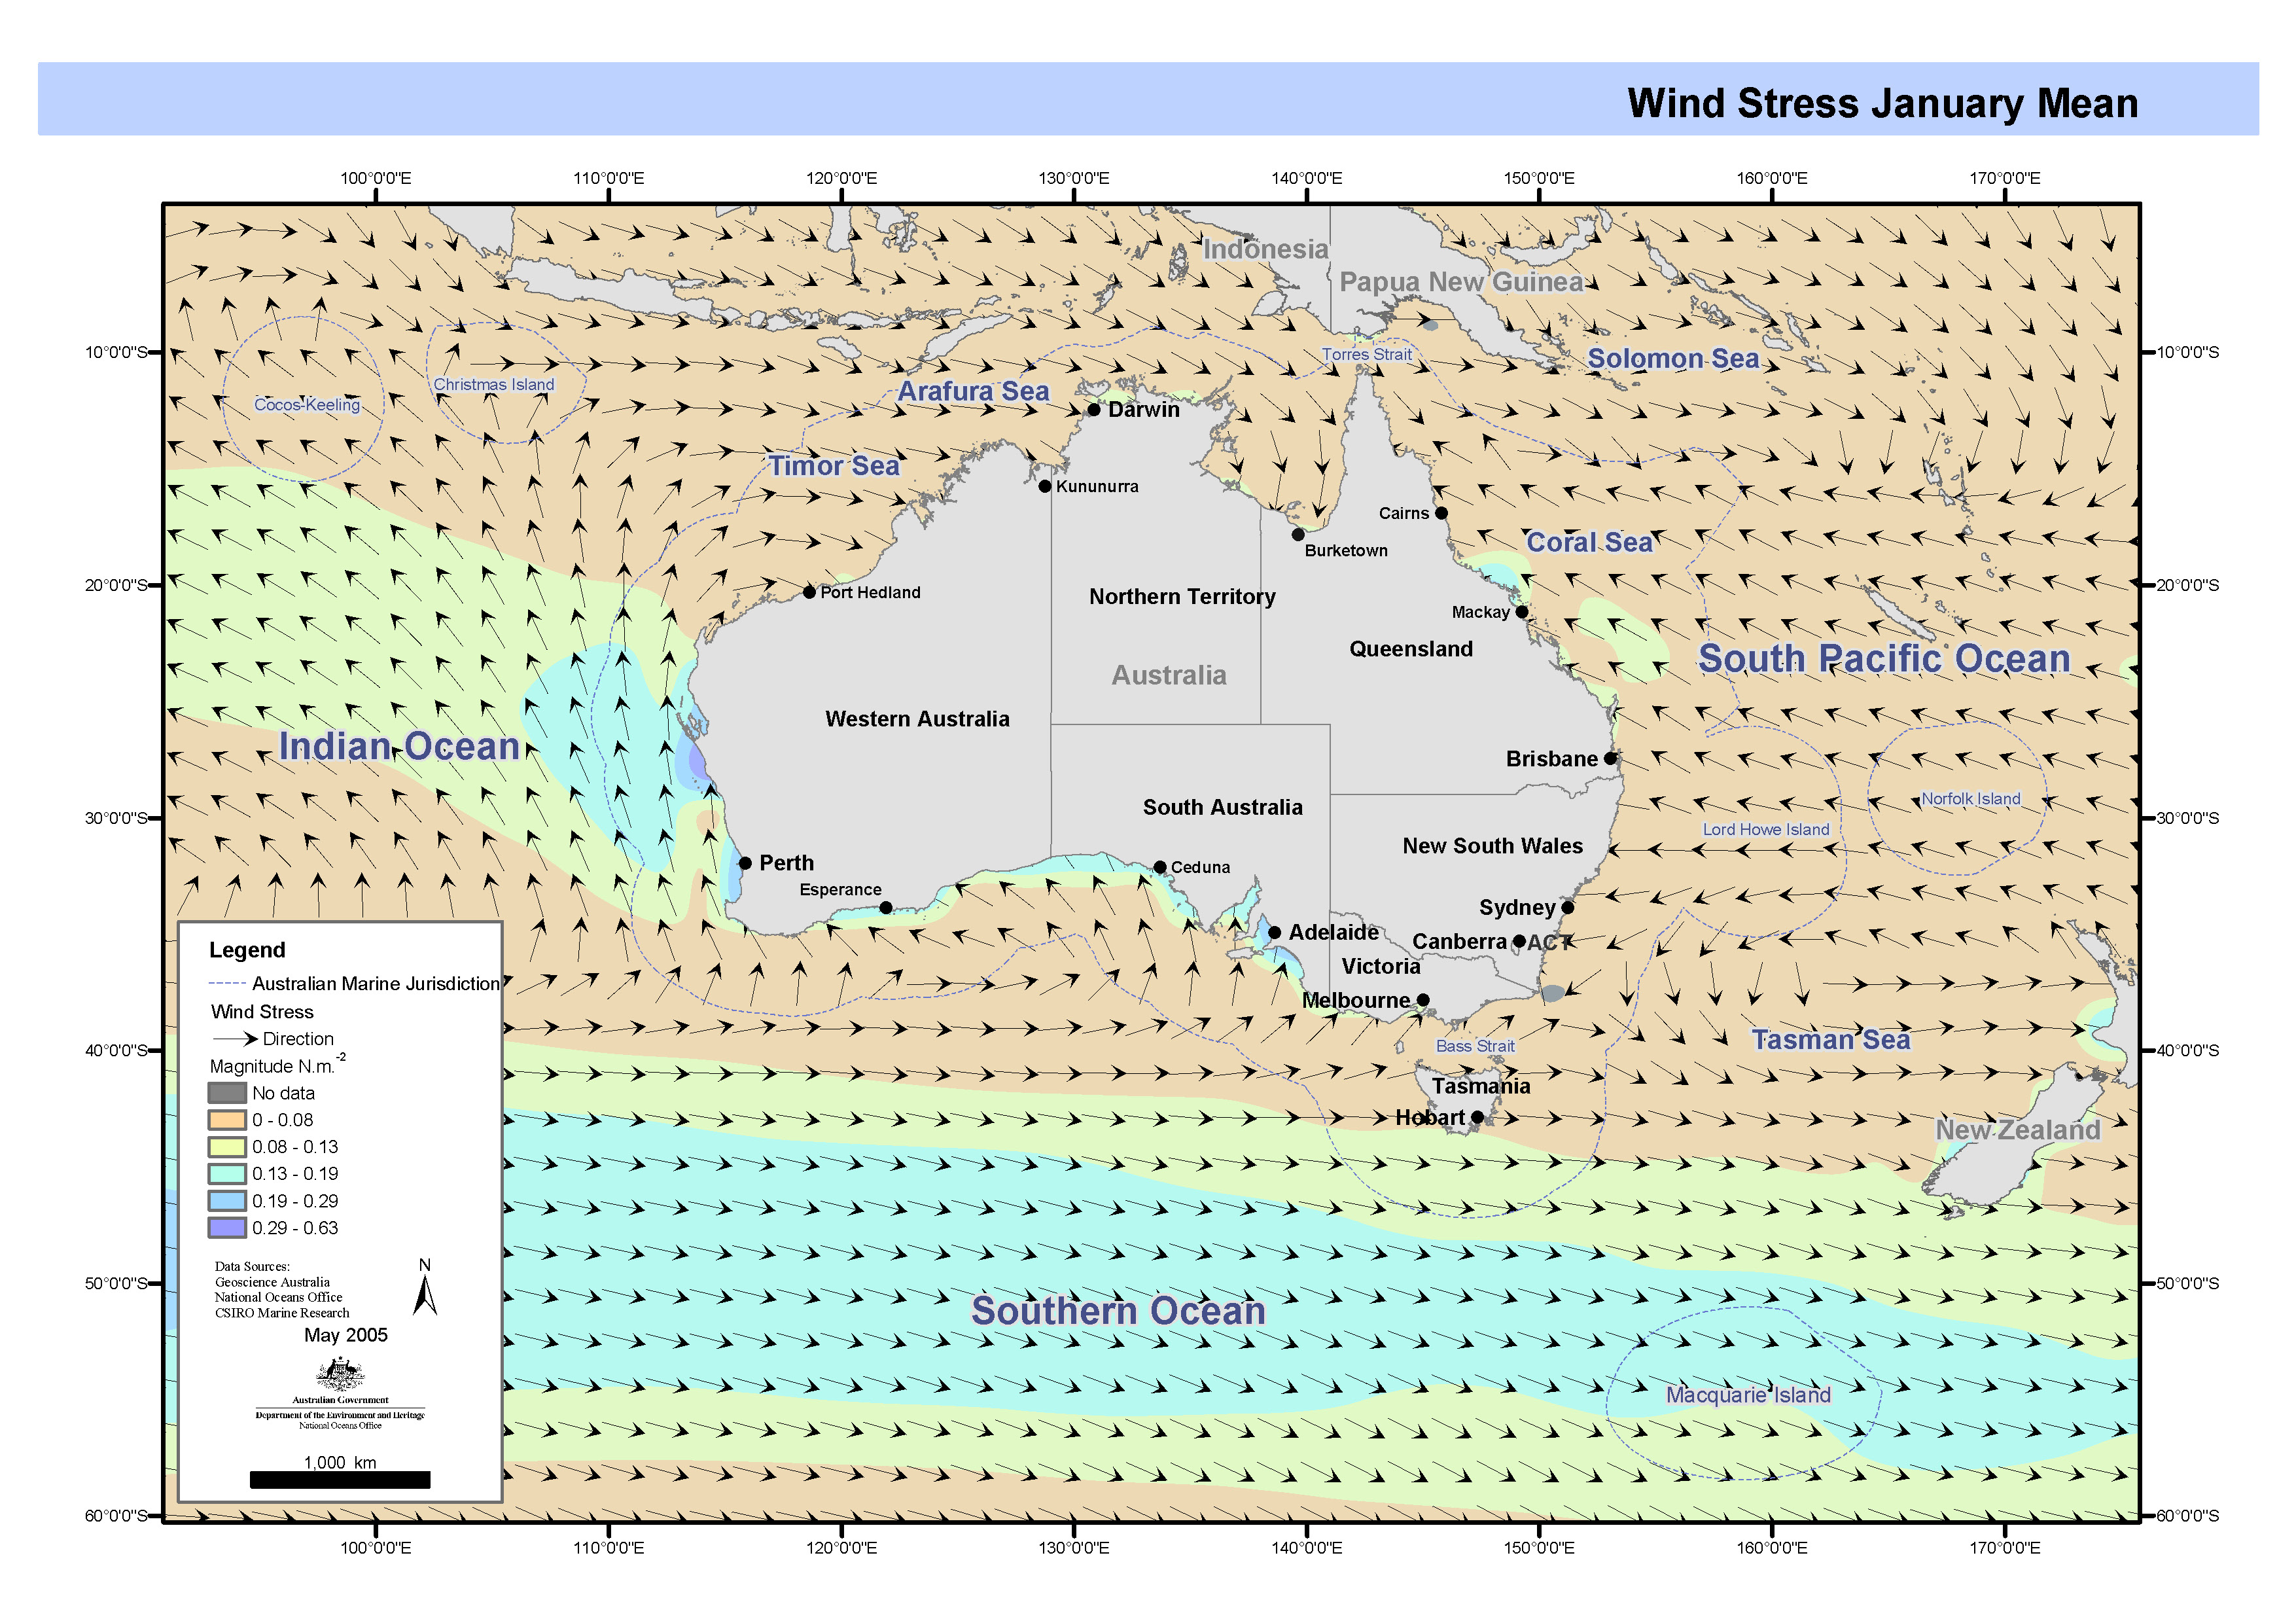
Maps showing quarterly means of wind stress on Australia's oceans from data supplied by the National Centers for Environmental Prediction (NCEP) Re-analysis Project, 1976 to 1998 inclusive. This map has been produced by CSIRO for the National Oceans Office, as part of an ongoing commitment to natural resource planning and management through the 'National Marine Bioregionalisation' project.
-
Ocean net primary production (ONPP) is defined as the rate of inorganic carbon uptake into the ocean biosphere, minus respiration. Biological processes, chiefly photosynthesis, can remove carbon from the dissolved inorganic ocean reservoir, providing an important potential sink for atmospheric carbon. This carbon flux into the ocean biosphere constitutes the base of the pelagic marine food web, directly affecting fishery productivity (Behrenfeld et al., 2002). As part of the Earth Observing System (EOS) science activities at Goddard Space Flight Center (GSFC), the National Aeronautics and Space Administration (NASA) is applying models to remote sensing data from the Moderate Resolution Imaging Spectroradiometer (MODIS), aboard the Terra and the Aqua spacecraft, to compute two indices of ONPP. The key model input data for the ONPP models are 8 day (weekly) composite averages of the MODIS semi-analytic chlorophyll product (Chlor_a_3) and the MODIS daytime sea surface temperature (D1) in Integerized Sinusoidal Equal Area Grid (ISEAG) projection, at 4.63 km resolution. Both models also use photosynthetically available radiation (PAR) is derived from surface incident short-wave surface flux estimates provided by NASA's Data Assimilation Office (DAO). The PAR, which is provided in one degree, unprojected global observations for every 3 hours, is averaged over the MODIS weekly period of eight days. For the P2 model only, daily synoptic mixed-layer depth (MLD) at one degree resolution is provided by the U.S. Navy's Fleet Numeric Meteorology and Oceanography Center, and also averaged to the MODIS weekly period. This was extracted from http://modis.gsfc.nasa.gov/data/atbd/atbd_mod19.pdf being the parts relevant to the 4km mapped modis monthly mean chlorophyll, K_90, suspended solids and sea surface temperature data. MODIS datasest are routinely recalibrated as data collection algorithms and seasonal biases are refined by NASA over time.